🚀 Infigo Insights Problem Solvers 🚀

Learn about our Infigo Insights reporting module

Reporting Centre Overview


The reporting centre gives admin users the ability to extract data from Catfish via a CSV download. The idea is that through the available reports you can obtain all the information you need to then generate your own custom reports offline.


Reports

There are currently 5 reports available under the Reporting Centre.

Each data extract is supplied as an individual CSV file for importing or manipulating in your own software programs (Excel, MIS, Accounting etc.). You can configure the date range for which you would like the data extracted from.


Sales Order Summary

Contains information at an order level. Order status, shipping status, order totals, checkout attributes, payment methods and includes an entry for each order during the date range selected.


Sales Order Line Detail

Order line item level information. Individual items ordered, specification and product attributes, quantities and line price totals and includes an entry for each order line item during the date range selected.


Customer

Contains a list of customers created on (between the dates selected) and registered on the storefront including all their account address details, last logged in date and if their accounts are active. (Please note, to see all customers on the storefront, unselect a start date.)


Customer logins

Generates a list of all registered customers and information on their login history including their last logged in date and number of times they have logged in within the date range selected.


Products

A simple product report that includes all created products on your storefront. It includes information about the product like weight, stock and also the total number of times it has been ordered, total quantity ordered and last time it was ordered.


Note: Each report is at a storefront level, there are currently no platform reports available.


How-To

In order to access the Reporting Centre, simply log in to the storefront admin and either search for 'Reports' or find it in the menu by selecting 'Insights' > 'Reports'.

  1. Firstly select the report you wish to run from the drop down.
  2. Select if you want the report to include column headers or not (we would also recommend this is selected so you know what each column is for)
  3. Select your date range
    1. Either select 'Show all dates' if you want to pull all information since the storefront was created
    2. Select a start date and time and a end date and time.
  4. Click 'Generate Report'

What is Insights?


Insights is our reporting module and is the answer to all your reporting needs.

We have spent many months creating this module to give our customers a reporting platform that is scalable, flexible and built for the future.


How does it work?

Each customer now has their own reporting database, you won't see or even know it exists but trust us - this is what drives your reporting data. It is independent from your live transactional database and we did this for a number of reasons:

  • Performance - when running complex or multiple reports it should not impact your live storefronts as the data is stored separate.
  • It allowed us to restructure the data into a more purposeful and meaningful schema with the sole purpose of providing reports.

The data is then synced between the live database and the reporting database so that your reports are as close to real time as possible.


How can I get Insights and is there a cost?

Insights is broken down into four plans, each allowing you different levels of access and customisation for your reporting needs.


mceclip0.png

Click here to view this chart online


Insights Standard

This is our entry level plan and comes as standard with every Infigo platform.

Your functionality and its benefits are limited but you can see what is included here.


Insights Pro

This is our first paid plan and is there to give you a taste of the real power of Insights.

You will be provided with a login to your Insights admin portal where you can create your own custom reports. Found out more about Insights Pro here.


Insights Pro+

Pro+ is a step up from Pro where the functionality remains the same but you will have the ability to create more custom reports, have more users accessing it and also the ability to schedule these reports (Metabase Dashboard Subscriptions). Found out more about Insights Pro+ here.


Insights Enterprise

As the name suggests, this is our Enterprise offering of Insights. In this plan you will have your own dedicated Insights portal, our highest limits on producing custom reports and dashboard subscriptions and also the introduction of creating your own dashboards. Found out more about what Insights Enterprise has to offer here.


How do I use it?

The answer to this question depends on the Insights plan you are on, but ultimately what your customers/users will see in admin is a new menu item called 'Insights.'

This contains all the reporting options within Infigo all in one place. If you previously used Reporting Centre to retrieve your reports, you will now be able to find this as a sub menu item under 'Insights' (Reporting Center (Legacy)).


mceclip1.png

In addition to this you will see two new menu items called 'Dashboards' and 'Reports'. And these are all driven from the Insights portal.


Follow these links to find out more about Dashboards and Insights Reports.


NOTE: All dates used in any reports, dashboards or subscriptions are in UTC

Insights Standard


Insights Standard is our out-the-box Insights offering. All the foundations are in place for you to utilise Infigo Insights but your features are limited to what is listed in this article.


Standard Reports

Insights Standard includes our hard-coded list of default reports. Similar to those that were previously offered in our Reporting Centre but we've given it a bit of a tidy up. We have reviewed the current reports and additional information, removed some unnecessary information and re-ordered columns to make them more intuitive and helpful.

To learn more on what reports are included as standard you can read our article on the Standard Insights Reports.


Standard Dashboards

Insights Standard also includes our hard-coded Dashboards. This is a new feature as part of Insights and is essentially a collection of reports that are displayed nicely in a dashboard. The purpose of the dashboards is to provide you with an in-depth snapshot of the performance of your Infigo platform and its storefronts. Out-the-box you will have access to two Dashboards, our B2B dashboard and our B2C dashboard.

These are available under Insights > Dashboards 


mceclip0.png

To learn more about our Dashboards have a read of our article here.

Insights Standard Reports


Insights Reports is a core feature of our Insights module and probably its most powerful. 

Found within admin under Insights > Reports, we offer out-of-the box five default reports, all of which allow you to configure a start and end date for the data to be captured, and then a format that you would like the report delivered in.


Default Reports

Customer Login Report

This report contains a list of all customers on that storefront and their login activity, including their last login date and time and also the number of times they have logged in within the reporting period.


Customer Report

This report contains a list of customers created on (between the dates selected) and registered on the storefront including all their account address details, last logged in date and if their accounts are active. (Please note, to see all customers on the storefront, unselect a start date.)


Sales - Order Summary

This report contains a list of all orders placed within the reporting period. It contains a vast amount of information at an order level including who placed the order, the shipping and billing addresses, shipping method selected, payment method used, order totals and much, much more.


Sales - Order Line Detail Report

This report is similar to the Order Summary report but includes details of the order line items instead of the order, including product information, quantity, discounts, weight and much, much more.


Department Report

This report contains details of all the departments created on the storefront, including department name, cost centre, who is assigned to that department and if you are limiting payment and shipping methods by department then which ones.


With all of these reports you can select a start and end date to determine the date range of the information that is returned and we also allow you to choose between a CSV, JSON, or Excel spreadsheet file format depending on your needs.


Custom Reports

These default reports are all very nice and provide you with the ability to obtain lots of data from your Infigo storefront, however the real power from Insights comes from being able to create your own Custom Reports.


NOTE: All dates used in any reports, dashboards or subscriptions are in UTC

Insights Pro


Insights Pro is our entry level paid tier. You can see the costs and a breakdown of whats included and the differences between our different plans here.

With Insights Pro you get everything included in the Insights Standard plan but you also get access to the Insights Portal (Metabase) so that you can create and modify your own Custom Reports.


On upgrading to Insights Pro, you will be provided with two admin logins to the Insights Portal. Here your reporting teams are able to create up to 5 custom reports.

You will have access to explore your reporting database tables to view all the data stored there and once familiar with database tables and the data stored within them you can create your own reports using the different report creation tools that Metabase has to offer.

To create your custom reports you will have access to two report builders in Metabase - Simple and Custom - that provides you with a UI to guide you through the report creation process. 

Once you have created your reports you can save them in a number of locations that will determine their access by others.

  • Saving them in your personal collection will mean only that user can view and access those reports when logged into Metabase
  • Saving them in the Custom > Other Collection will make them available to all your Metabase users when logged into Metabase as that is a shared collection.
  • Saving them in the Custom > Reporting Collection will mean that the reports are published to your Infigo platform and available to all your Infigo admin users to run and download from within Insights > Reports.


Take a look at our Insights Pro welcome guides to help get you up to scratch

Episode 1 - The basics


Insights Pro Quick Start Guide Videos


Episode 1 - The basics

This video runs you through the basics of getting to know your Infigo Insights Metabase Portal.

It covers some useful tips, Metabase 'Collections' and a brief look at your reporting database and its tables.


Episode 2 - Creating Custom Reports

This video runs you through the process of creating your very own custom reports using the Simple Question builder.


Episode 3 - Publishing your reports to Infigo

This video takes the report we created in Episode 2 and shows you the steps of publishing it out to your Infigo platform.

Insights Pro+ (Plus)


Insights Pro+ is our intermediate, best bang-for-your-buck, paid tier. It gives you the customisation and flexibility to create a rich reporting experience for our users without the need to go all the way to Enterprise.

With Insights Pro+ you get everything included in the Insights Pro plan but you also get access to the Advanced SQL report writer AND we allow you to modify and customise our Default Dashboards.

You can see the costs and a breakdown of what's included and the differences between our plans here.


Creating custom SQL reports

The most powerful way to create your custom reports in Metabase is to use the SQL report builder (Native question). We recommend this approach is reserved only for those that have experience writing and using Structured Query Language (SQL) as it can be quite complex.

Its power comes from you not being restricted by any UI driven report approach. If you understand the data structure of your database then you can create any reports you wish using this advance custom SQL.

If you'd like to create your own SMTP for sending reports then you will need our Insights Enterprise package. 


To read more on how to create SQL Reports have a look at our Creating Custom Reports article.


Assistance with troubleshooting your own SQL reports is not supported under your support contract, however we do offer creating advanced reports for you as paid professional service. Is this is something you would like us discuss with us then please raise a ticket.


If you wish to upgrade to Insights Pro+ at anytime please contact sales or raise a support ticket.


Creating Dashboard Subscriptions (scheduled reports)

If you wish to schedule a custom report to run periodically then you will need to create a dashboard and subscribe to it. 

This Metabase article walks you through the 'how to': 

https://www.metabase.com/docs/latest/users-guide/dashboard-subscriptions.html 


Creating Insights Custom Reports


The real power and benefit from our Insights module comes from providing our customers with the ability to create their own custom reports.

This functionality is only available with our Pro Planor above so if you wish to upgrade, then please raise a support ticket or contact our sales team.


How-To

Once you have subscribed to a Pro, Pro+ or Enterprise plan you will be issued a dedicated Insights Portal URL and login. This portal is powered by Metabase, which is a very powerful reporting front end tool. Have a read of our Metabase article to understand more about the underlying software that is powering your Insights Portal.


Understanding your Reporting Database

In order to make the most from your data you need to understand what and how data is stored.

You can find your Reporting Database by logging into your Metabase instance and navigating to Our Data > Your platform name

Click on the database and then select 'Reporting' from the list of folders.

You're then presented with your reporting database. You can see each of the tables that are available and you can click on any of them to view the data stored within.


mceclip1.png

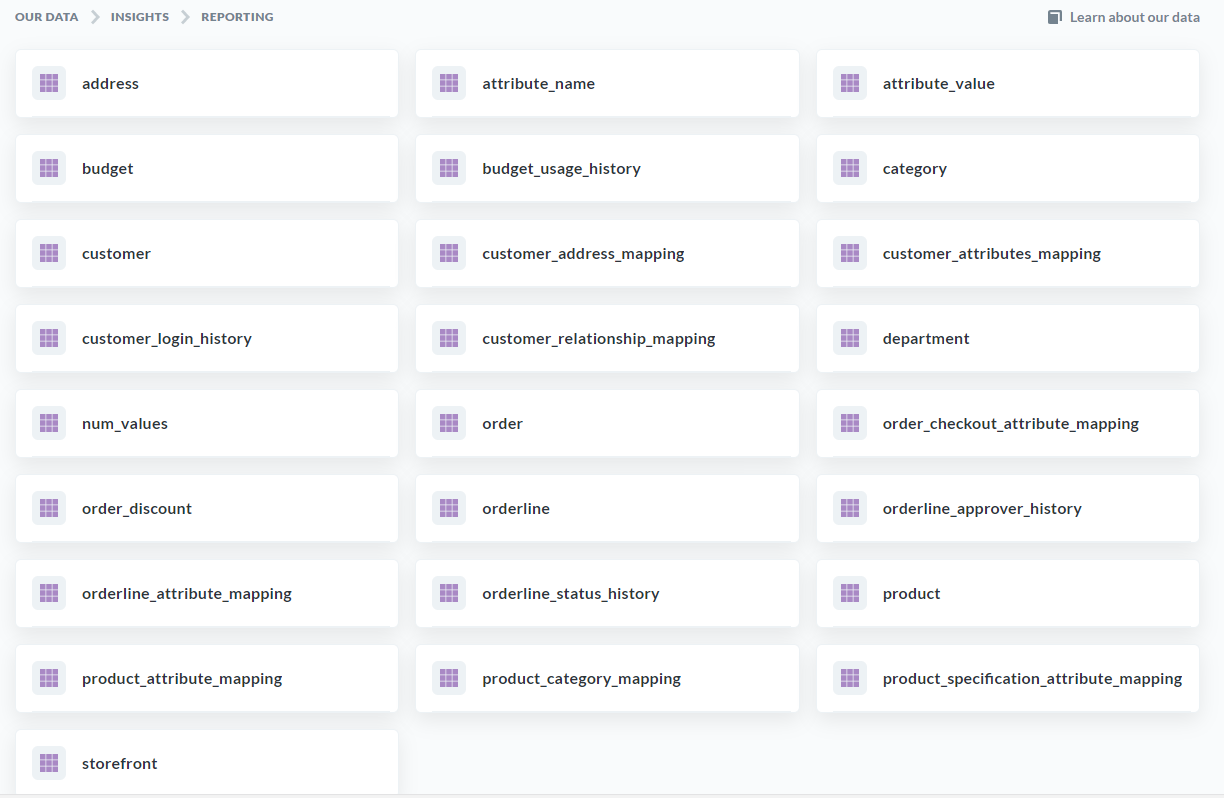
These are the tables that you will then be using to build your custom reports.

For example, in the screenshot above you will see tables called 'order' and 'product' and these are where most of the order and product information is stored respectively.


Have a watch of our Quick Start Guide video below to get you up to speed:


Creating a Simple Question (Report)

Now you have had a look at how the Database is laid out and the data that is at your disposal, we will look at how you can use this data to create your own Custom Reports.

In Metabase this is called a Question and they offer three different methods of creating a question - through their simple question UI, Custom question UI or Native query editor.

We're going to focus on how to build a Simple question which is, as the name suggests, the simplest way and requires very little technical knowledge to do so.

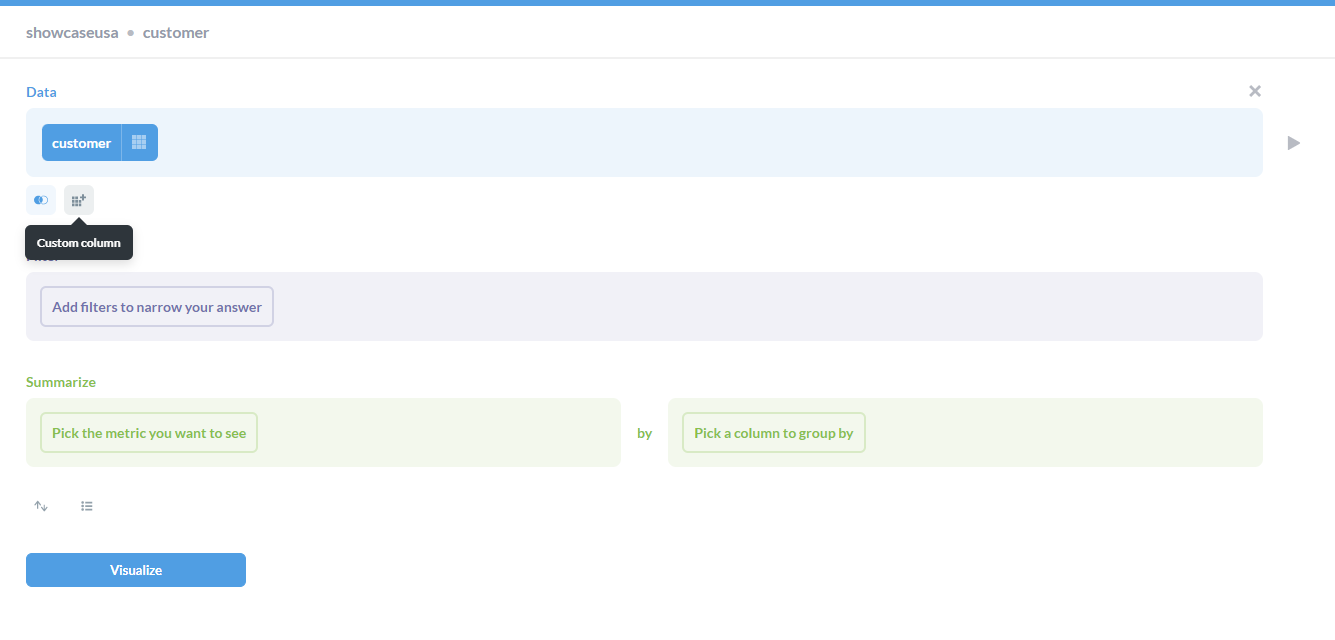
First click on the 'Ask a question' button in the top right of your Metabase page. 

mceclip2.png

Then you you will be presented with the three options for creating a question as we mentioned above - select 'Simple question.' Now select your database and the table you want to create your question on.

Check out this tutorial video by Metabase, which talks you through the steps of creating your custom reports or watch our video below:


Filtering your custom reports by Storefront ID

It is a common requirement for a report to be available across all storefronts but to be filtered by the storefront ID automatically so that each storefront admin will only be downloading their storefronts data. 

Rather than having to create a report for each storefront individually and hardcoding the storefront filter into each (this would be very time consuming and unmanageable if you have lots of storefronts and lots of reports) we allow for this to be done dynamically.

To achieve this you simply need to create a custom column called 'storefront_id' as this is a reserved column name in Infigo that will inject the storefront Id into when accessing it from different storefronts.


If you are creating the report using the 'Custom Queston' builder then once you select your tables you need to click the 'add custom column' button

mceclip0.png

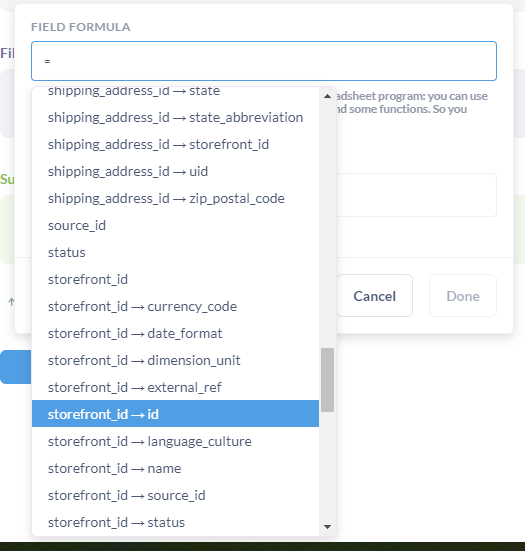
Then from the list of available data you need to select storefront_id.

mceclip1.png

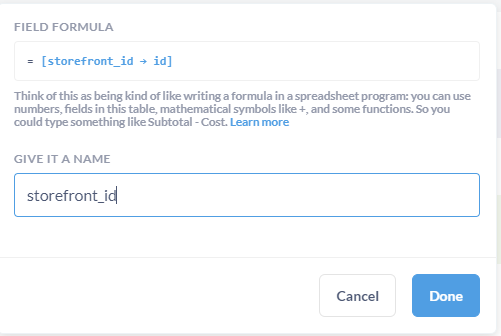
And give it the name 'storefront_id'

mceclip2.png


Filtering your native SQL reports by Storefront ID

To achieve the same thing, if you have Insights Pro+, and are using the native SQL report building then you can do this by using the following placeholders in your SQL statement:


{{storefrontId}}

An example of this in a SQL report might look like this:

DECLARE @accountId as INT;

[[ SET @accountId = {{storefrontId}}; ]]

SELECT * FROM [reporting].[customer]


NOTE: All dates used in any reports, dashboards or subscriptions are in UTC

Insights Dashboards


Insights Dashboards are collection of nicely presented reports that help to provide a snapshot of your current Infigo storefront.

Our Standard Insights Dashboards include a B2B and a B2C version, both differing slightly in the reports included within them and how they are arranged. And also a platform dashboard that is made only available on your Infigo platform that shows slightly different reports to allow you to compare the performance of all your storefronts.


B2B Dashboard

This dashboard has been created with the storefronts aimed at a B2B market predominantly. It focuses on active users, and departments along with the performance of your products and categories. Click here to understand more about the reports we show as part of the B2B Dashboard.


B2C Dashboard

This dashboard has been created with reports aimed more for a B2C focused storefront. Sales focused it includes reports like average sale total, Sales by year, Registrations by month and your best performing products and categories. Click here to understand more about each of the reports we show as part of the B2C Dashboard.


Although the two dashboards above have been created with B2B and B2C setups in mind you are not restricted from only using the B2B dashboard on your B2B storefronts and vice versa. You can view both dashboards on any of your storefronts and view the reports from either of them as you see fit.


Platform Dashboard

We also created a third dashboard that is only displayed at Platform level in Infigo that focuses on providing a comparison of the performance of all of your storefronts. Click here to understand more about each of the reports we show as part of the Platform Dashboard.


NOTE: All dates used in any reports, dashboards or subscriptions are in UTC


Using the Insights Portal (Metabase)


This portal is powered by Metabase which is a very powerful front end reporting tool. We chose to use Metabase for Insights as it is a globally recognised software specifically designed and built for turning data into meaningful information through a powerful but intuitive UI.

Metabase also has an in-depth library of help and support information online including their very own online courses that are free to follow. More information about these can be found here: https://www.metabase.com/learn/


Learning the Metabase lingo

In order to follow the Metabase documentation you need to first understand their terminology for the different features of the system.

They have a Glossary of Metabase terms which you can refer to any time. 


Setting up permissions for Reports and Dashboards


In order to control who can see what Insights Reports and Dashboards on your platform you can use our Insights Permissions. These permissions can be applied to a customer role and to either a Dashboard or a Question/Report and similar to our standard Access Permissions you can either provide or deny access.


Setting up Insights Permissions

You can find all the controls for setting up Insights Permissions in Infigo admin under Insights > Permissions. By default, no permissions are required to access all Insights content and so everyone that has an admin login can view everything.


Insights Permission Settings

Currently, there is just one setting which you can find on the Settings tab on the Permissions page and its to allow you to determine if you want to allow access or deny acces by default. How you set this setting then determines how you go about creating your Permission Rules.

By default, the 'Default access is allowed' setting is enabled. If you wanted to switch this off and deny access by default then you would generally be setting up your Permission Rules to explicitly allow access to specific customer roles for specific Insights Dashboards or Reports. If you left the setting as is - enabled - then you would create your Permission Rules to deny access to specific customer roles for specific Insights Dashboards or Reports.


 Creating Permissions

The process for creating Insights Permissions for Dashboards and Questions/Reports is the same. 

First click the 'Add permissions' button.

Then select from the drop down the Question or Dashboard you want to apply this rule to, you can also select 'All' if you want the rule to apply to all of them.

mceclip0.png

Then, from the Roles dropdown list, select the customer role you want to apply this rule for. Again you can select 'All' from the list if you want the rule to be created for all customers roles.

mceclip1.png

The lastly, use the Access switch to determine if you are denying or allowing access. Keep the switch off if you want to deny access or switch it 'on' if you want to allow access.

mceclip4.pngmceclip3.png

Finally, click 'Add'.


Now you will see the Permission Rule you just created added to the Rules List. 

From here you can chage the permission access to deny/approve as you wish and also Delete the permission if you no longer need it.

mceclip5.png


Once happy with all the Permission Rules you have setup, click 'Save' in the top right corner.

Why are my Insights reports showing the wrong time zone?


Problem

Your Insights reports are showing times in UTC, rather than your local/storefront time zone.

For example:

  • Order shows as 17:13 UTC instead of 12:13 PST

Cause

This is expected behaviour.

  • All Insights data (via Metabase) is stored and reported in UTC by default
  • Standard reports do not automatically convert to local/storefront time zones

Resolution

Option 1: Download report using timezone conversion (recommended)

When downloading a report, select a timezone-specific option such as:

  • CSV (UTC-08:00)

This will convert eligible date/time fields into your storefront’s timezone at the point of download.

👉 As shown in the example on page 2, selecting this option adjusts the displayed timestamps in the exported file.


Important note ⚠️

  • This conversion only applies to columns that end in “Utc” (e.g. CreatedOnUtc)
  • The conversion happens during download, not within the database itself

Option 2: Use custom reports (advanced)

If you need timezone-adjusted data in:

  • Scheduled emails
  • Custom dashboards
  • Automated reporting

You can:

  • Create custom SQL reports
  • Apply timezone conversion logic within the query

This allows reports to output directly in your desired timezone.


Limitations

  • Metabase email subscriptions will always send reports in UTC
  • There is currently no global setting to change all reports to a local timezone
  • Timezone conversion depends on:
    • The download option selected
    • The storefront timezone configuration

Key takeaway đź’ˇ

Insights data is always stored in UTC. If you need local time, you must either:

  • Use the CSV timezone download option, or
  • Build a custom report with timezone conversion

Still not working?

Check the following:

  • You selected the correct CSV timezone option when downloading
  • Your storefront timezone is set correctly
  • You’re reviewing fields that support conversion (e.g. those ending in “Utc”)

If times are still incorrect, it may require further investigation into storefront configuration or report setup.

Platform Dashboard

Below is a breakdown of all the default reports we display on our Infigo Insights Platform Dashboard.

This dashboard and many of these reports are only available if you login using your platform admin login and navigate to the platform level in Infigo.


Count of Active Users by Storefront

A table that shows a breakdown by storefront of all the current users that are set to 'Active' on that storefront.

mceclip0.png


# Orders in the last 30 Days

Quite simply a figure that is a count of all orders placed within the last 30 days.

Excludes: All orders that are currently marked as Cancelled or Deleted.

mceclip3.png


Total Revenue by Storefront

A table that displays the Storefront, the default Storefront Currency and the Total Revenue - a sum of all order totals that have been placed on each storefront.

Excludes: All orders that are currently marked as Cancelled or Deleted.

mceclip1.png


# Registration in the last 30 days by Storefront

A bar chart that shows the count of newly created users per storefront where their date of registration is within the last 30 days.

Includes: Only customers who are currently marked as 'Active'


mceclip2.png


# Orders by Storefront

A bard chart that shows a count of all the orders placed on each storefront.

Excludes: All orders that are currently marked as Cancelled or Deleted.


mceclip3.png


Sales By Product - Platform

This report is a table of the top 20 Products ordered by the number of orders they have been included in. The table includes the Product name, the Storefront they are on, the default Storefront Currency, Total Revenue - the sum of all the order line price including tax for that product, the number of orders - a count of all orders that have not been cancelled or deleted, and the number of items - the sum of all order line quantities.

Includes: Currently published Products ONLY

Excludes: Orders that are currently marked as Cancelled or Deleted. Order lines that are currently marked as Cancelled.


mceclip4.png


Sales By Category - Platform

Similar to the Sales By Product report but instead of reporting on individual products, it reports on the top categories based on the performance of all the products of all the products within that category.

Includes: Currently published Categories ONLY

Excludes: Orders that are currently marked as Cancelled or Deleted. Order lines that are currently marked as Cancelled.


mceclip5.png

B2C Dashboard

Below is a breakdown of all the default reports we display on our Infigo Insights B2C Dashboard


# Orders in the last 30 Days

Quite simply a figure that is a count of all orders placed within the last 30 days.

Excludes: Orders that are currently marked as Cancelled or Deleted. 

mceclip3.png


Sale This Month

This is a sum of all the order totals in the current month to date. It also includes a comparison of the same figure in the previous month.

Excludes: Orders that are currently marked as Cancelled or Deleted.

mceclip2.png


Sales By Month

A simple bar chart


Excludes: Orders that are currently marked as Cancelled or Deleted. Order lines that are currently marked as Cancelled.

mceclip1.png


# Registrations By Month

A bar chart that shows the number of new users that have registered on your storefront each month for the last 10 months.

Includes: Only customers that are currently set as 'Active'

mceclip0.png


Sales By Product

This report is a table of the top 20 Products ordered by the number of orders they have been included in. The table includes the Product name, Total Revenue - the sum of all the order line price including tax for that product, the number of orders - a count of all orders that have not been cancelled or deleted, and the number of items - the sum of all order line quantities.

Includes: Currently published Products ONLY

Excludes: Orders that are currently marked as Cancelled or Deleted. Order lines that are currently marked as Cancelled.


mceclip2.png


Sales By Category

Similar to the Sales By Product report but instead of reporting on individual products, it reports on the top categories based on the performance of all the products as a results of all the products performance that category.

Includes: Currently published Categories ONLY

Excludes: Orders that are currently marked as Cancelled or Deleted. Order lines that are currently marked as Cancelled.


mceclip0.png


Job Status Overview

A pie chart that shows the total count split of open jobs on the storefront that are in one of the following statuses:

  • 'Output Creation Started'
  • 'Output Creation Failed'
  • 'Awaiting Approval'
  • 'Awaiting Data'
  • 'Awaiting Parts'
  • 'Awaiting Proof'
  • 'On Hold'
  • 'Future Order'
  • 'Unapproved Order'
  • 'Rejected'
  • 'Recreation Requested'
  • 'Mis Failed'
  • 'Copy To Hotfolder Failed'
  • 'Blocked'
  • 'Mis Assets Failed'
  • 'Partially Approved'
  • 'Mis Additional Action Required'
  • 'Ordered'
  • 'Output Created'
  • 'In Hotfolder'
  • 'Approved'
  • 'Downloaded'
  • 'Verified'
  • 'Mis Notification Retrigger'
  • 'Copy To Hotfolder Skipped'
  • 'Artwork Uploaded'
  • 'Action Run'
  • 'Printed'
  • 'In Artworking'
  • 'In Finishing'
  • 'In Packing'
  • 'In Production'
  • 'In Reprographics'
  • 'Mis Notified'
  • 'Mis Order Processed'
  • 'Mis Assets Ok'
  • 'Ready For Collection'
  • 'Mis Manifested'

Excludes: All orders that are currently marked as Cancelled. All Orders that currently have a shipping status of 'Shipped' or 'Delivered'. All Order lines that are currently marked as Cancelled.

mceclip7.png


Sales By Delivery Country & Sales By Delivery State

A map that plots the destination shipping address for your storefront's orders. The map will either be of the United States showing your distribution by state, or a map of the world showing your distribution by country.

The key on the left shows the darker the blue the more orders have been shipped to that location.

Excludes: All orders that are currently marked as Cancelled or Deleted. Orders where shipping country is NULL.

mceclip8.png

Average Sale Total

A simple value showing the average order total value of all orders on your storefront and is displayed in your storefronts default currency.

Excludes: All orders that are currently marked as Cancelled or Deleted.

mceclip1.png


# Orders Awaiting Shipping

A count of all orders where the shipping status is not delivered or shipped.

Includes: Orders that do not have a shipping status of 'Shipped' or 'Delivered'.

Excludes: All orders not in the 'Processing' status.

mceclip6.png


Sales By Year

A bar chart showing the sum of all the order totals collected for each year.

Excludes: All orders that are currently marked as Cancelled or Deleted.


mceclip4.png

B2B Dashboard

Below is a breakdown of all the default reports we display on our Infigo Insights B2B Dashboard


Orders By Department

This report is a pie chart that demonstrates a count of all orders that have been placed that are not deleted or cancelled broken down by each department.

Excludes: Orders that are currently marked as Cancelled or Deleted.

mceclip0.png


Most Active Users

This report is a table that lists the email address, first name, last name, department and number of logins for the top 100 users ordered by number of times they have logged in. 

Includes: Only customers that have an email address saved.

Excludes: Customers that are currently set as 'inactive' or have been deleted.

mceclip1.png


Sales By Product

This report is a table of the top 20 Products ordered by the number of orders they have been included in. The table includes the Product name, Total Revenue - the sum of all the order line price including tax for that product, the number of orders - a count of all orders that have not been cancelled or deleted, and the number of items - the sum of all order line quantities.

Includes: Currently published Products ONLY

Excludes: Orders that are currently marked as Cancelled or Deleted. Order lines that are currently marked as Cancelled.


mceclip2.png


Sales By Category

Similar to the Sales By Product report but instead of reporting on individual products, it reports on the top categories based on the performance of all the products of all the products within that category.

Includes: Currently published Categories ONLY

Excludes: Orders that are currently marked as Cancelled or Deleted. Order lines that are currently marked as Cancelled.


mceclip0.png


Sales By Month

A simple bar chart


Excludes: Orders that are currently marked as Cancelled or Deleted. Order lines that are currently marked as Cancelled.

mceclip1.png


# Orders in the last 30 Days

Quite simply a figure that is a count of all orders placed within the last 30 days.

Excludes: Orders that are currently marked as Cancelled or Deleted. 

mceclip3.png


# Orders Awaiting Shipping

A count of all orders where the shipping status is not delivered or shipped.

Includes: Orders that do not have a shipping status of 'Shipped' or 'Delivered'.

Excludes: All orders not in the 'Processing' status.

mceclip6.png


Job Status Overview

A pie chart that shows the total count split of open jobs on the storefront that are in one of the following statuses:

  • 'Output Creation Started'
  • 'Output Creation Failed'
  • 'Awaiting Approval'
  • 'Awaiting Data'
  • 'Awaiting Parts'
  • 'Awaiting Proof'
  • 'On Hold'
  • 'Future Order'
  • 'Unapproved Order'
  • 'Rejected'
  • 'Recreation Requested'
  • 'Mis Failed'
  • 'Copy To Hotfolder Failed'
  • 'Blocked'
  • 'Mis Assets Failed'
  • 'Partially Approved'
  • 'Mis Additional Action Required'
  • 'Ordered'
  • 'Output Created'
  • 'In Hotfolder'
  • 'Approved'
  • 'Downloaded'
  • 'Verified'
  • 'Mis Notification Retrigger'
  • 'Copy To Hotfolder Skipped'
  • 'Artwork Uploaded'
  • 'Action Run'
  • 'Printed'
  • 'In Artworking'
  • 'In Finishing'
  • 'In Packing'
  • 'In Production'
  • 'In Reprographics'
  • 'Mis Notified'
  • 'Mis Order Processed'
  • 'Mis Assets Ok'
  • 'Ready For Collection'
  • 'Mis Manifested'

Excludes: All orders that are currently marked as Cancelled. All Orders that currently have a shipping status of 'Shipped' or 'Delivered'. All Order lines that are currently marked as Cancelled.

mceclip7.png


Sales By Delivery Country & Sales By Delivery State

A map that plots the destination shipping address for your storefront's orders. The map will either be of the United States showing your distribution by state, or a map of the world showing your distribution by country.

The key on the left shows the darker the blue the more orders have been shipped to that location.

Excludes: All orders that are currently marked as Cancelled or Deleted. Orders where shipping country is NULL.

mceclip8.png

Insights Enterprise

Overview

Insights Enterprise is, as the name suggests, our Enterprise offering. In this plan you will have your own dedicated Insights portal, our highest limits on producing custom reports and pulses and also the introduction of creating your own dashboards. Found out more about what Insights Enterprise has to offer here.


Creating custom SQL reports

The most powerful way to create your custom reports in Metabase is to use the SQL report builder (Native question). We recommend this approach is reserved only for those that have experience writing and using Structured Query Language (SQL) as it can be quite complex.

Its power comes from you not being restricted by any UI driven report approach. If you understand the data structure of your database then you can create any reports you wish using this advance custom SQL.

With Enterprise you can also setup your own SMTP to send 


To read more on how to create SQL Reports have a look at our Creating Custom Reports article.


Assistance with troubleshooting your own SQL reports is not supported under your support contract, however we do offer creating advanced reports for you as paid professional service. Is this is something you would like us discuss with us then please raise a ticket.


Creating custom Dashboards

Insights Dashboards are collection of nicely presented reports that help to provide a snapshot of your current Infigo storefront.

As standard Insights Dashboards include a B2B and a B2C version, both differing slightly in the reports included within them and how they are arranged, but with Enterprise you can create your own Dashboards. 


Managing Custom Metabase Permissions

You'll also gain the ability to configure access permissions on your dedicated Metabase environment - if you require assistance with this, please take a look
at Metabases' thorough guidance or raise a ticket with the Support Team.
Permissions overview | Metabase Documentation


If you wish to upgrade to Insights Enterprise at anytime please contact sales or raise a support ticket.

Incomplete

Can’t find what you need?

Ask our Infigo Support Team for help..

🔎
Loading…
    Select a Problem Solver